Case study · Government · 2020 to 2026
Road-crash hotspot intelligence
Ranking 460 crash hotspots with geospatial analysis and deep learning
Geospatial analysis and deep-learning risk models that place every crash on a national road network, score risk for every segment, and rank 460 priority hotspots on 142 roads, each with candidate countermeasures.
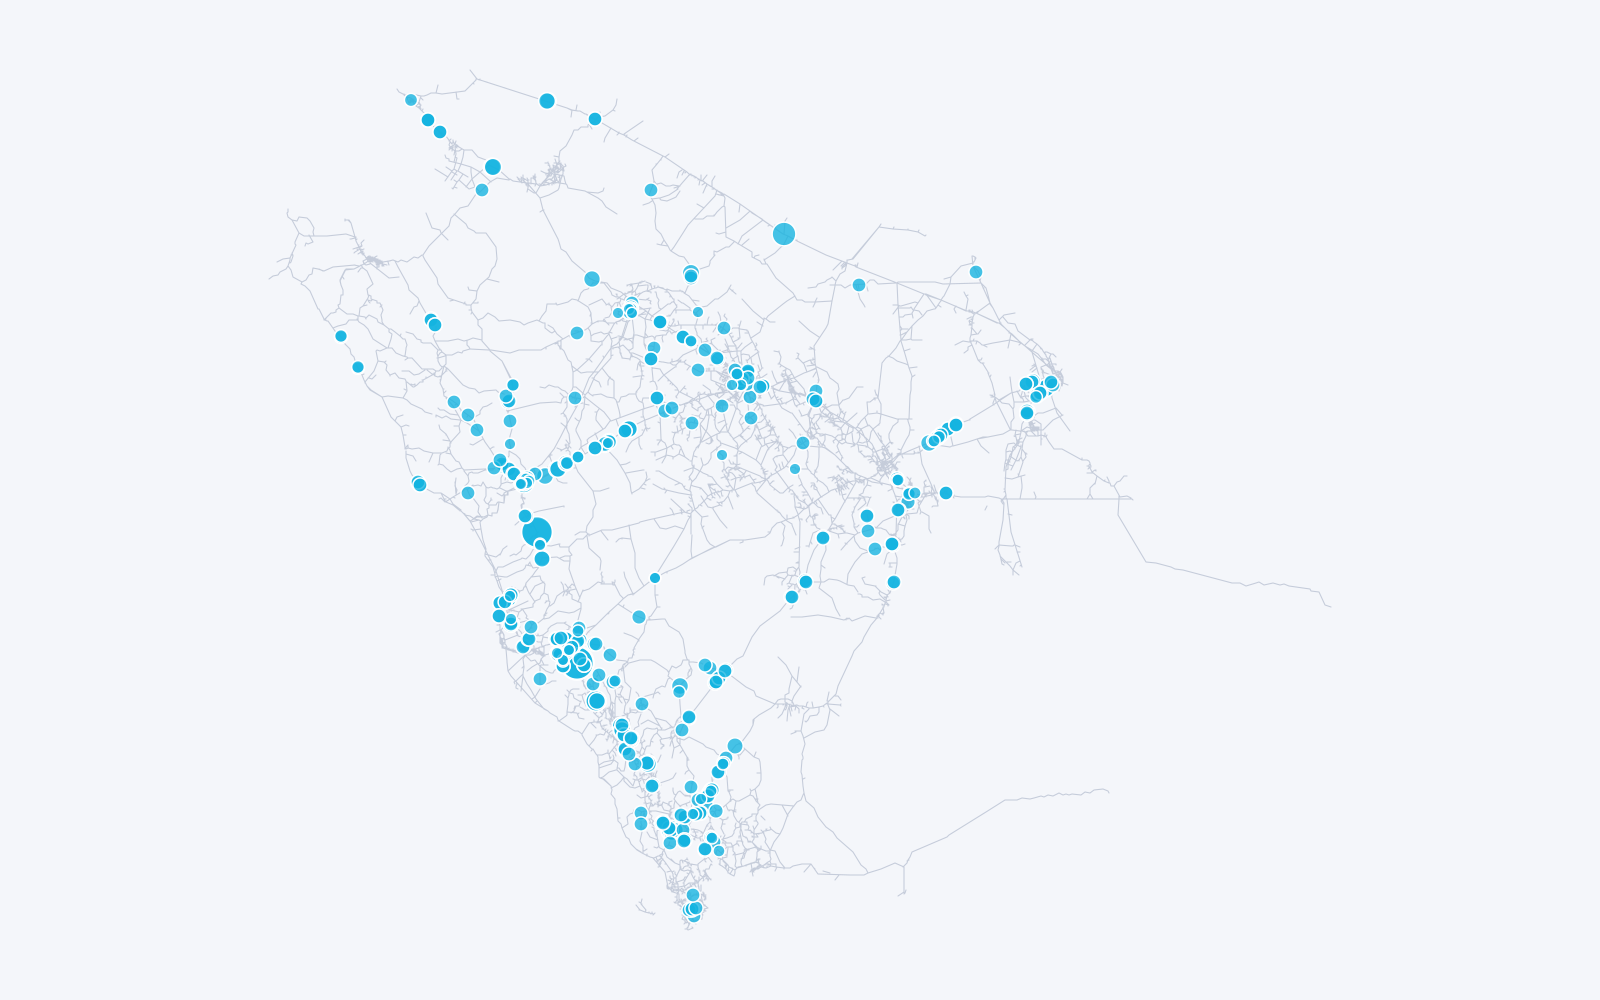
- priority hotspots identified on 142 national roads
- 460
- priority hotspots identified on 142 national roads
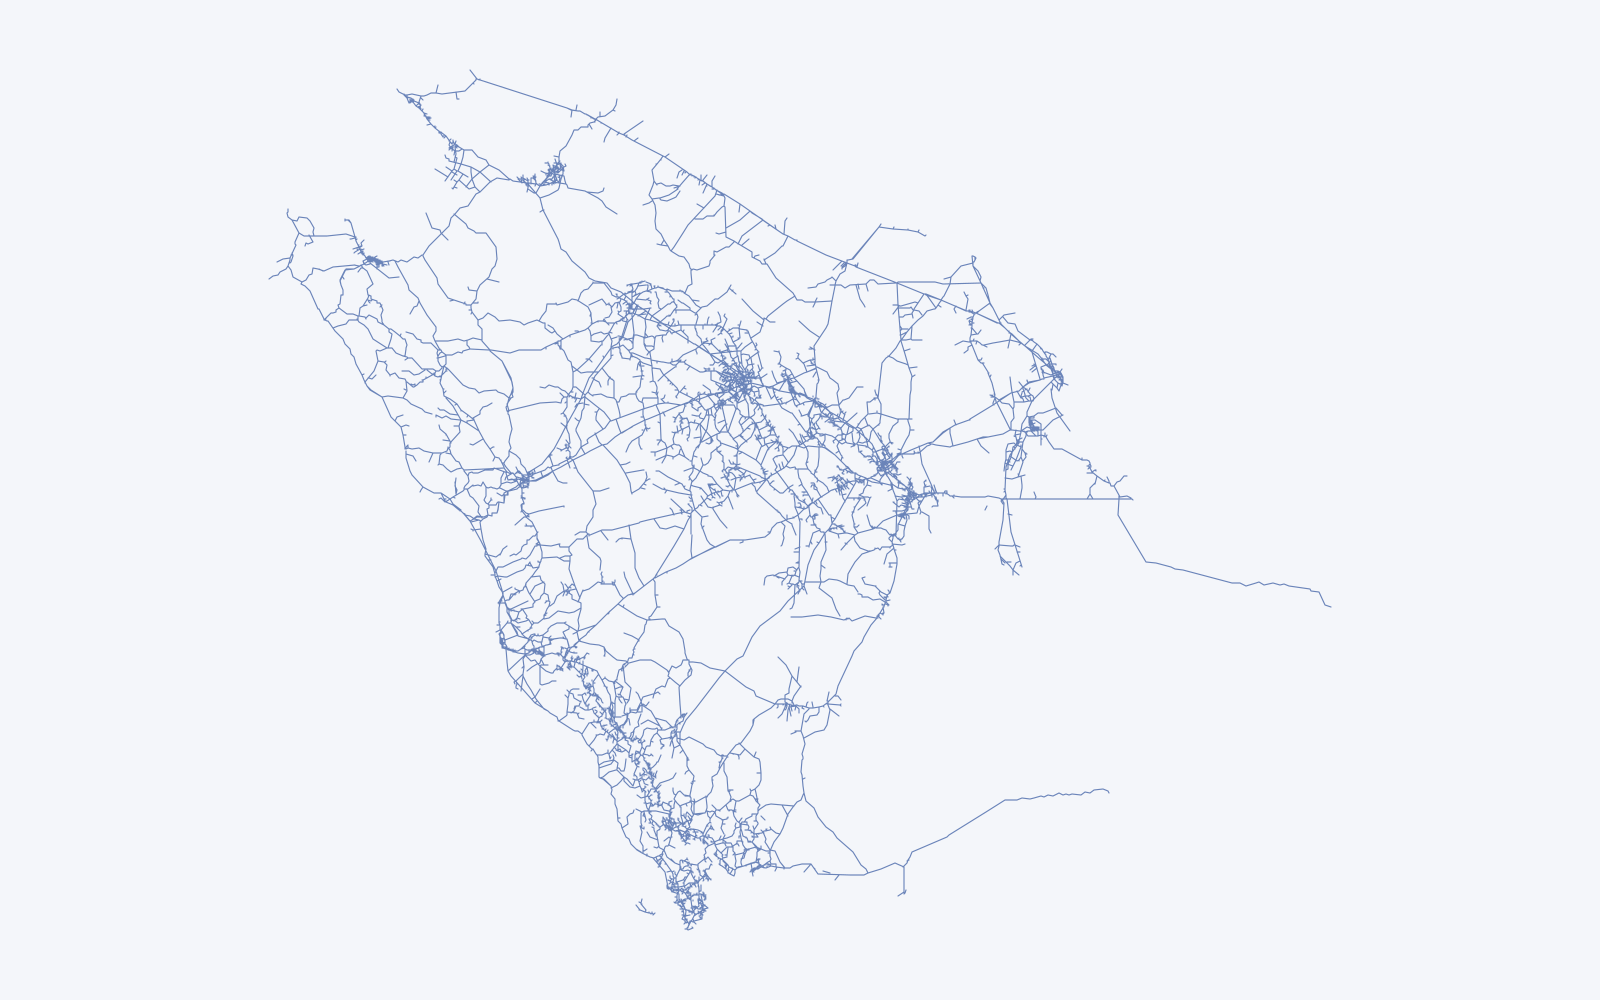
- road segments mapped across the national network
- 18,000
- road segments mapped across the national network
- crash-to-hotspot links analysed, 2020 to 2022
- 26,500
- crash-to-hotspot links analysed, 2020 to 2022
- crashes enriched with the weather at the time
- 65,000
- crashes enriched with the weather at the time
The question
Road-safety budgets are finite. Engineers need to know which kilometre of which road to treat first, and the evidence behind the choice. Counting past crashes answers half of that question; the other half is where risk is building now.
Method
- Place every crash on the network. Crashes are matched to kilometre markers along about 18,000 road segments on roughly 5,200 numbered roads. Crash-to-marker distances are precomputed in the warehouse, so queries stay interactive.
- Weight by severity. Each location is scored in Equivalent Property Damage Only (EPDO) units: 275 for a fatal crash, 40 for an injury crash and 1 for damage only.
- Learn where risk is building. Deep-learning models score crash risk for every road segment from crash history, traffic volume and speed, road geometry, weather and time of day. Engineers see where risk is rising, as well as where crashes have already clustered.
- Keep the ranking explainable. The models propose; severity-weighted scores and the crash evidence behind each location decide the final list, so every hotspot can be defended to a road authority.
- Let engineers set the lens. Analysts choose the radius, look-back period and threshold, and filter by severity, cause, crash type, time of day, weather and region. Colour bands of up to three standard deviations from the mean show how far each location stands out.
- Attach the fix. Each hotspot lists candidate countermeasures ranked by crash modification factor.
- Add context. 64,889 crash records from 2016 to 2022 carry the historical weather at the time and place of the crash.
The geospatial stack
GDAL, Fiona and pyproj handle spatial formats and projections, including Esri geodatabases. The deep-learning models are trained in Python and their segment scores are written back to the same warehouse as the crash data, so maps and models never disagree. Maps run on Mapbox GL JS with right-to-left Arabic labels and a geocoder, and Turf.js does spatial calculations in the browser.
Results
- 460 priority hotspots on 142 national roads, from about 26,500 crash-to-hotspot links between 2020 and 2022.
- A network-wide map of about 18,000 road segments in all 13 regions.
- About 65,000 crashes analysed with the weather at the time they happened.
- A risk score for every road segment, refreshed as new crash and traffic data arrives.
Other location intelligence
- Urban indicators. An observatory of urban indicators with interactive maps for a GCC municipal ministry, 2021 to 2022.
- Delivery zoning. Address-keyword zoning that sends each e-commerce order to the cheaper courier for its zone. See the beauty-brand case.
- Store-level prices. Branch-level pricing across 41 supermarkets in three countries. See Fattuta.
Platform and infrastructure
- Azure Machine Learning
- Trains, versions and evaluates the deep-learning risk models.
- Azure Virtual Machines
- Run the hotspot engine, model scoring, the spatial processing (GDAL, Fiona, pyproj) and the analyst map application.
- Azure Blob Storage
- Holds the road-network GeoJSON, crash extracts and the Esri geodatabase uploads.
- Azure Monitor
- Alerts on the platform's compute, memory and disk.